A Simple Guide to Understand Your Solar Inverter App
You open your solar inverter app on a beautiful sunny South African afternoon.
The panels are producing 4.2 kW.
Excellent!
But then you notice:
House: 1.6 kW
Battery: 1.9 kW
Grid: 0.7 kW
There are arrows going everywhere.
Some are green. Some are blue. Some point towards the battery. Others point away from it.
And somewhere in the middle is a little picture of a house.
You bought solar panels.
You didn’t realise there would be an exam afterwards.
Fortunately, the basic principle is much simpler than the screen makes it look.
There Are Really Only Four Places to Watch
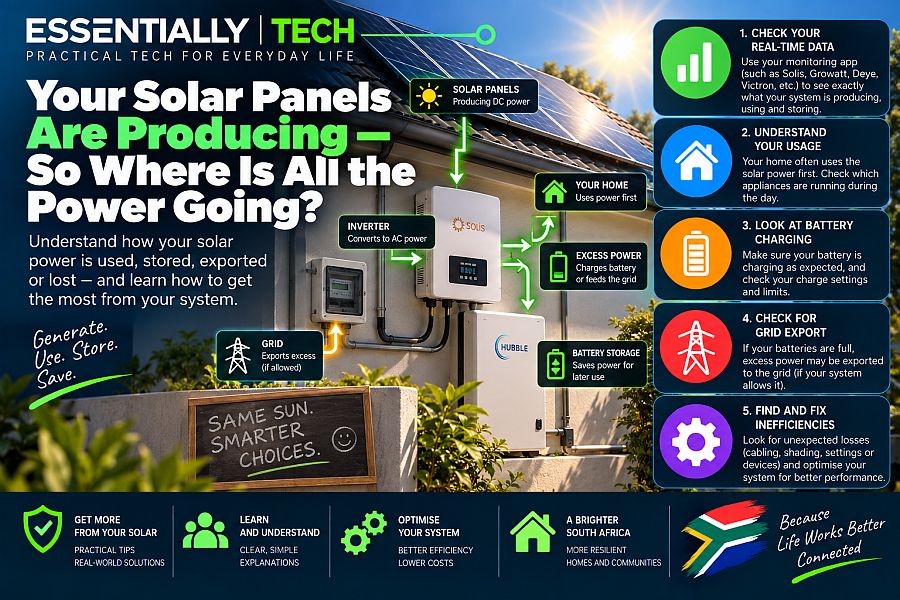
Almost every residential solar monitoring system is showing some variation of the same four things:
☀️ Solar panels — electricity being generated.
🏠 House / Load — electricity being consumed.
🔋 Battery — electricity being stored or supplied.
⚡ Grid — electricity being imported or exported.
That’s basically it.
Everything else is detail.
The clever part is watching which direction the electricity is flowing.
1. Solar: What Are My Panels Producing?
The solar or PV figure shows approximately how much power your panels are producing right now.
For example:
PV: 4.2 kW
means your panels are currently producing about 4,200 watts.
It does not mean they have produced 4.2 kWh today.
Remember our rule from the previous Essentially Tech article:
kW = power right now.
kWh = energy over time.
If the panels continuously produced 4.2 kW for one hour, they would generate approximately:
4.2 kWh
of energy during that hour.
But solar output constantly changes.
Clouds move.
The sun moves.
Panels heat up.
Household loads change.
So don’t be surprised when that number moves around.
That’s exactly what it should do.
2. Load: What Is My House Using?
This may be the most useful number on the entire screen.
Your Load, Consumption or House figure shows how much electricity the home is consuming at that moment — subject to exactly what your particular installation is configured to measure.
Imagine it says:
House: 650 W
Now switch on the kettle.
Suddenly:
House: 2.6 kW
Congratulations.
You’ve just met your kettle.
Switch it off and the load falls again.
This is actually a brilliant way to learn about your house.
Turn appliances on and off while watching the app and you’ll quickly discover which ones make a meaningful difference.
Geyser comes on?
Big jump.
Pool pump?
Noticeable jump.
LED light?
You may barely see it.
This turns your inverter app into a surprisingly useful home energy monitor.
3. Battery: Charging or Discharging?
This is where people often get confused because the battery figure can represent power flowing in either direction.
Arrow pointing towards the battery?
The battery is charging.
Arrow pointing away from the battery?
The battery is discharging.
Suppose you have:
Solar: 4.0 kW
House: 1.5 kW
Battery charging: 2.5 kW
Beautiful.
Your panels are supplying the house and the excess solar is charging the battery.
Ignoring conversion losses for simplicity:
4.0 − 1.5 = 2.5 kW
Everything balances.
Now imagine it’s 20:00:
Solar: 0 kW
House: 800 W
Battery discharging: 800 W
The battery is now supplying the house.
Again, simple.
4. Grid: Buying or Selling?
The grid symbol represents your connection to the electricity network.
This is another one where direction matters.
If power is flowing:
Grid → House
you’re importing electricity.
In other words:
You’re buying electricity.
If power is flowing:
House/Solar → Grid
you’re exporting electricity.
Whether you are allowed to export, whether the export is limited, and whether you receive any credit for exported energy depends on your municipality, electricity supplier, tariff and system configuration.
So don’t assume that electricity flowing back to the grid automatically means you’re being paid for it.
The Golden Rule: The Numbers Have to Balance
This is the trick that makes the whole diagram suddenly make sense.
Electricity being produced or supplied has to go somewhere.
Imagine:
Solar: 5 kW
Your house is using:
2 kW
That leaves roughly:
3 kW
Where can it go?
Perhaps:
Battery charging: 3 kW
Or:
Battery charging: 2 kW
Grid export: 1 kW
Or the inverter may reduce solar production because there’s nowhere useful for the extra power to go.
The exact behaviour depends on your system configuration.
But the principle remains:
Power coming in ≈ power going out.
There will be small differences due to conversion losses, measurement timing and sensor accuracy, so don’t expect every screen to balance perfectly to the last watt.
Let’s Read a Few Typical Screens
Scenario 1: Sunny Morning, Battery Charging
Solar: 3.5 kW
House: 1.2 kW
Battery: +2.3 kW
Grid: 0 kW
Translation:
The sun is running the house and charging the battery.
Excellent.
Scenario 2: Battery Full, Plenty of Sunshine
Solar: 2.0 kW
House: 2.0 kW
Battery: 100%, approximately 0 kW
Grid: 0 kW
Translation:
The panels are supplying what the house needs. The battery is full, so it doesn’t need charging.
But perhaps your solar array could produce more.
This is where smart load shifting becomes useful.
Turn on the dishwasher.
Run the washing machine.
Heat the geyser if your system has been designed to do so.
Run the pool pump.
Instead of buying that electricity later, use your available solar now.
Scenario 3: Cloud Passes Over
A moment ago:
Solar: 4.5 kW
Now:
Solar: 900 W
But the house still needs:
2 kW
Where does the missing 1.1 kW come from?
Depending on your settings:
Battery: 1.1 kW discharge
or perhaps some/all of it comes from:
Grid: import
Then the cloud moves away.
Solar jumps back up.
Nothing is wrong.
Your inverter is simply balancing supply and demand in real time.
Scenario 4: Night-Time
Solar: 0 W
House: 500 W
Battery: 500 W discharge
Grid: 0 W
Translation:
The battery is running the house.
Now switch on a 2 kW heater:
House: 2.5 kW
Battery: 2.5 kW discharge
That’s when you should start paying attention.
The battery hasn’t suddenly become faulty.
You’ve simply dramatically increased the rate at which you’re consuming its stored energy.
Which brings us to another very useful number.
SOC: Your Battery’s Fuel Gauge
SOC means State of Charge.
Think of it as the battery equivalent of your car’s fuel gauge.
100% SOC = battery full.
50% SOC = roughly half its usable monitored charge remains.
But here’s the important bit:
SOC tells you how much is left.
Load tells you how quickly you’re using it.
A battery at 50% while the house is using 300 W may have plenty of useful runtime remaining.
The same battery at 50% while the house is using 5 kW is a completely different situation.
So don’t stare only at the battery percentage.
Watch the load as well.
Why Does My Battery Stop at 20%?
This is another common question.
Your inverter may be deliberately configured not to discharge the battery below a certain SOC.
For example:
Minimum SOC: 20%
That reserve might exist to protect the battery, maintain emergency backup capacity or comply with the way your installer has configured the system.
So if the battery reaches 20% and the house suddenly starts using grid electricity, it doesn’t necessarily mean anything has gone wrong.
The inverter may simply be following instructions.
And depending on the system, there may be different minimum SOC settings for normal grid operation and grid outages.
Don’t change these settings casually unless you understand what they do.
Why Am I Buying Electricity When the Battery Isn’t Empty?
This one causes endless head-scratching.
You look at the app:
Battery: 55%
yet you’re importing electricity from the grid.
Why?
There are several possible reasons.
Your system may have:
- reached its configured minimum SOC;
- been programmed to preserve battery power for outages;
- entered a time-of-use schedule;
- reached a battery discharge-power limit;
- been configured not to discharge at certain times; or
- encountered a load larger than the battery/inverter is configured to supply.
So:
Battery remaining does not automatically mean battery available.
The inverter’s settings decide how and when that stored energy may be used.
Why Is My Solar Production Low on a Beautiful Sunny Day?
Here’s another counter-intuitive one.
Suppose you have a 6 kWp solar array.
It’s midday.
Not a cloud in sight.
Yet the app says:
Solar: 1.4 kW
Before climbing onto the roof looking for a broken panel, look at the rest of the screen.
Perhaps:
Battery: 100%
House: 1.4 kW
Grid export: disabled
Where would another 4 kW go?
Nowhere.
So the inverter may simply reduce — or curtail — PV production because there is no demand for the additional energy.
Your panels aren’t necessarily failing.
The house may simply not be asking for more power.
This is a perfect time to run something useful.
This Is Where Load Shifting Becomes Powerful
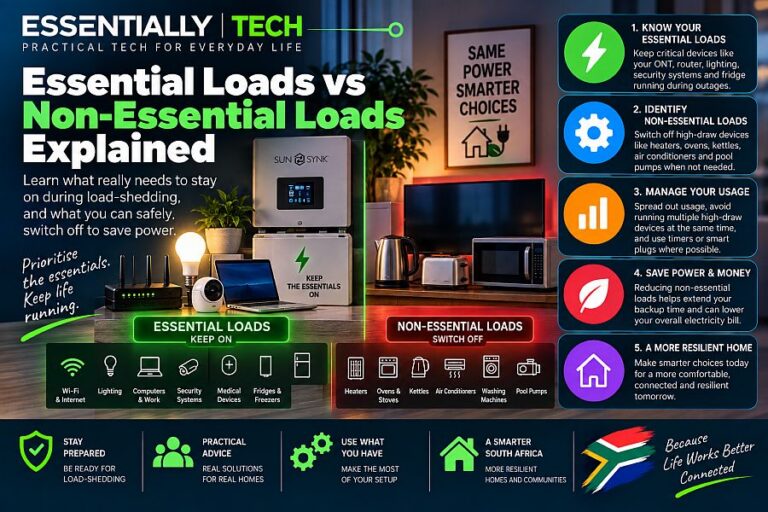
Remember our previous article about essential and non-essential loads?
Here’s where the two ideas meet.
Imagine it’s 12:30:
Solar potential: Plenty
Battery: 100%
House: 600 W
Instead of leaving all that potential solar unused and then switching the geyser on at 18:00, consider moving suitable loads into the daytime.
Run:
Geyser → while solar is strong
Pool pump → during daylight
Dishwasher → around midday
Washing machine → during PV production
You’re not necessarily reducing the electricity those appliances require.
You’re changing where that electricity comes from.
And that’s one of the secrets to getting real value from solar.
Don’t Obsess Over Every Watt
Solar apps are fascinating.
Possibly too fascinating.
It’s very easy to find yourself opening the app twenty times a day and wondering:
“Why did solar just drop 300 watts?”
“Why is the battery charging at 1.8 kW instead of 2 kW?”
“Where did that extra 147 watts go?”
Don’t.
These systems are continuously adjusting.
Clouds, refrigerators cycling, battery management, inverter conversion, appliance thermostats and dozens of other little changes happen throughout the day.
Look for patterns, not individual watts.
The Five Numbers Worth Understanding
If you’re new to your inverter app, ignore most of the advanced information initially.
Learn these first:
| Reading | What It Tells You |
|---|---|
| PV / Solar | What your panels are producing now |
| Load / House | What your home is consuming now |
| Battery Power | Whether the battery is charging or discharging, and how fast |
| Battery SOC | Approximately how much battery charge remains |
| Grid | Whether you’re importing or exporting electricity |
Once you understand those five, most of the pretty arrows suddenly stop looking mysterious.
Essentially: The TL;DR
When you open your inverter app, don’t be intimidated by the diagram.
Think of your solar system as four boxes:
☀️ SOLAR
What am I making?
🏠 HOUSE
What am I using?
🔋 BATTERY
Am I storing electricity or using stored electricity?
⚡ GRID
Am I buying electricity or sending it back?
Then follow the arrows.
If solar production exceeds household demand, the extra energy may charge the battery, be exported where permitted, or simply not be produced if the system has nowhere to send it.
If household demand exceeds solar production, the difference has to come from the battery, the grid, or a combination of both.
“And remember: Don’t just watch how much solar you’re producing. Watch where it’s going. Because once you understand that, you stop merely owning a solar system … and start learning how to use it intelligently.”
— Essentially